Timeline
Proposal due Thursday, October 14
Draft report due Wednesday, November 17
Peer feedback due Monday, November 22
Final written report due Friday, December 3 (accepted until December 5)
Presentation video, slides, repo due Wednesday, December 8
Presentation comments due Friday, December 10
Introduction & grading summary
TL;DR: Pick a dataset and do something with it. That is your final project.
The final project for this class will consist of analysis on a dataset of your own choosing. The dataset may already exist, you may collect your own data by scraping the web.
Choose the data based on your group’s interests or work you all have done in other courses or research projects. The goal of this project is for you to demonstrate proficiency in the techniques we have covered in this class (and beyond, if you like!) and apply them to a dataset to analyze it in a meaningful way.
Logistics
You will work on the project with your lab groups.
The four primary deliverables for the final project are
- A written, reproducible report detailing your analysis
- A GitHub repository corresponding to your report
- Slides + a video presentation
- Formal peer review on another team’s project
Grading summary
The grade breakdown is as follows:
| Total | 100 pts |
|---|---|
| Project proposal | 5 pts |
| Written report | 50 pts |
| Slides | 10 pts |
| GitHub repo & reproducibility | 5 pts |
| Video presentation | 20 pts |
| Peer feedback | 10 pts |
Note: No late projects are accepted.
Data sources
In order for you to have the greatest chance of success with this project it is important that you choose a manageable dataset. This means that the data should be readily accessible and large enough that multiple relationships can be explored. Your dataset must have at least 500 observations and at least ten variables (or has been approved by Prof. Tackett). The dataset should include a rich mix of categorical, discrete numeric, and continuous numeric data.
If you are using a dataset that comes in a
format that we haven’t encountered in class (for instance, a .DAT file), make
sure that you are able to load it into RStudio as this can be tricky depending
on the source. If you are having trouble, ask for help before it is too late.
Data sets that can’t be used:
- Data sets that have been used for class examples or assignments.
- Data sets from Kaggle.
- Data sets analyzed in another course.
There will be limits on the number of groups that can use a given data set, so I encourage you to be creative!
Some resources that may be helpful:
Additions:
- World Health Organization
- The National Bureau of Economic Research
- International Monetary Fund
- General Social Survey
- United Nations Data
- United Nations Statistics Division
- U.K. Data
- U.S. Data
- U.S. Census Data
- European Statistics
- Statistics Canada
- Pew Research
- UNICEF
- CDC
- World Bank
- Election Studies
All analyses must be done in RStudio, and your final written report and analysis must be reproducible. This means that you must create an R Markdown document attached to a GitHub repository that will create your written report exactly upon knitting.
Project proposal
There are two main purposes of the project proposal:
- To help you think about the project early, so you can get a head start on finding data, reading relevant literature, thinking about the questions you wish to answer, etc.
- To ensure that the data you wish to analyze, methods you plan to use, and the scope of your analysis are feasible and will help you be successful for this project.
Choose three substantially different datasets you are interested in analyzing. For each, identify the components below.
Include the following in the proposal:
Introduction and Data
For each data set, include the following:
- Identify the source of the data,
- When and how it was originally collected (by the original data curator, not necessarily how you found the data)
- A brief description of the observations
Research question
- Describe the research topic along with a concise statement of the research question and hypotheses.
Data set
-
Use the
glimpsefunction to provide a glimpse of the data set. -
Place the file containing your data in the
datafolder of the project repo.
Submission
Submit the PDF of your proposal on Gradescope by Thursday, October 14 at 11:59pm. Be sure to select the names of all team members in the submission and mark all the pages associated with each data set. The teaching team will provide feedback on your proposal to help you determine a data set to use for the project.
Notes
- Project proposals should have no more than one page of text. (not including the output from
glimpse). - You must use one of the data sets in the proposal for the final project, unless instructed otherwise by Prof. Tackett.
Proposal grading
The project proposal will be graded as follows:
| Total | 5 pts |
|---|---|
| Introduction/data | 2 pts |
| Research questions | 2 pts |
| Results | 1 pts |
Draft report
The purpose of the draft and peer review is to give you an opportunity to get early feedback on your analysis. Therefore, the draft and peer review will focus primarily on the exploratory data analysis, modeling, and initial interpretations.
Write the draft in the written-report.Rmd file in your project repo. You do not need to submit the draft on Gradescope.
Below is a brief description of the sections to focus on in the draft:
Introduction and data
The introduction provides motivation and context for your research. Describe your topic (citing sources) and provide a concise, clear statement of your research question and hypotheses.
Then identify the source of the data, when and how it was collected, the cases, a general description of relevant variables.
Methodology
The methodology section should include visualizations and summary statistics relevant to your research question. You should also justify the choice of statistical method(s) used to answer your research question.
Results
Showcase how you arrived at answers to your research question using the techniques we have learned in class (and beyond, if you’re feeling adventurous).
Provide only the main results from your analysis. The goal is not to do an exhaustive data analysis (calculate every possible statistic and perform every possible procedure for all variables). Rather, you should demonstrate that you are proficient at asking meaningful questions and answering them using data, that you are skilled in interpreting and presenting results, and that you can accomplish these tasks using R. More is not better.
Peer review
Critically reviewing others’ work is a crucial part of the scientific process, and STA 199 is no exception. You will be assigned a team to review. As part of the review process, you must provide your partner team a copy of your current report by Wednesday, November 17 at 11:59pm. After giving the report to your partner team, they will have until Monday, November 22 at 11:59pm to provide a detailed critique about the written report and data analysis. This feedback is intended to help you create a high quality final project, as well as give you experience reading and constructively critiquing the work of others.
During the peer feedback process, you will be provided read-only access to your partner team’s GitHub repo. Provide your feedback in the form of GitHub issues to your partner team’s GitHub repo.
Peer feedback will be graded on the extent to which it comprehensively and constructively addresses the components of the partner team’s report: the research context and motivation, exploratory data analysis, and any inference, modeling, or conclusions. As you work on the draft, the focus should be on the analysis and less on crafting the final report. Your draft must include a reasonable attempt at each analysis component - exploratory data analysis, inference or modeling, and deriving initial results and conclusions.
Click here for peer review instructions.
Written report
Your final report must be written using R Markdown. All team members must contribute to the GitHub repository, with regular meaningful commits / pushes.
Before you finalize your report, make sure the printing of code chunks is turned off with the option echo = FALSE.
Submit the final report on Gradescope under the Written Report assignment on Gradescope. Your final report must match your GitHub repository exactly. The mandatory components of the report are below. You are free to add additional sections as necessary. The report, including visualizations, should be no more than 10 pages long. There is no minimum page requirement; however, you must comprehensively address all of the aspects mentioned below.
The written report is worth 50 points, broken down as follows:
| Total | 50 pts |
|---|---|
| Introduction/data | 5 pts |
| Methodology | 10 pts |
| Results | 20 pts |
| Discussion | 10 pts |
| Formatting | 5 pts |
Introduction and data
The introduction provides motivation and context for your research. Describe your topic (citing sources) and provide a concise, clear statement of your research question and hypotheses.
Then identify the source of the data, when and how it was collected, the cases, a general description of relevant variables.
Methodology
The methodology section should include visualizations and summary statistics relevant to your research question. You should also justify the choice of statistical method(s) used to answer your research question.
Results
Showcase how you arrived at answers to your research question using the techniques we have learned in class (and beyond, if you’re feeling adventurous).
Provide only the main results from your analysis. The goal is not to do an exhaustive data analysis (calculate every possible statistic and perform every possible procedure for all variables). Rather, you should demonstrate that you are proficient at asking meaningful questions and answering them using data, that you are skilled in interpreting and presenting results, and that you can accomplish these tasks using R. More is not necessarily better.
Discussion
This section is a conclusion and discussion. This will require a summary of what you have learned about your research question along with statistical arguments supporting your conclusions. You should critique your own methods and provide suggestions for improving your analysis and future work. Any potential issues pertaining to the reliability and validity of your data and the appropriateness of the statistical analyses should also be discussed. Additionally, include a brief paragraph on ideas for future work.
Formatting
This is an assessment of the overall presentation and formatting of the written report.
Video presentation + slides
Slides
In addition to the write-up, your team must also create presentation slides that summarize and showcase your project. Introduce your research question and dataset, showcase visualizations, and provide some conclusions. These slides should serve as a brief visual accompaniment to your write-up and will be graded for content and quality. For submission, convert these slides to a .pdf document to be submitted to Gradescope. The slides are due on Wednesday, December 8 at 11:59pm
The slide deck should have no more than 6 content slides + 1 title slide. Here is a suggested outline as you think through the slides; you do not have to use this exact format for the slide deck.
- Title Slide
- Slide 1: Introduce the topic and motivation
- Slide 2: Introduce the data
- Slide 3 - 4: Highlights from EDA
- Slide 4 - 5: Inference / modeling
- Slide 6: Conclusions + future work
Video presentation
Sometime by Wednesday, December 8, your group will upload a video presentation of your project to Warpwire. Note that all members must present. The video presentation must be no longer than 8 minutes. It is fine if the video is shorter than 8 minutes, but the 8-minute time limit will be strictly enforced.
For the presentation, you can speak over your slide deck, similar to the lecture content videos. Many groups have used Zoom to record the presentation; however, you can use whatever platform works best for your group. Below are a few resources to help you record video presentations:
- Recording presentations in Zoom
- Apple Quicktime for screen recording
- Windows 10 built-in screen recording functionality
- Kap for screen recording
Once your video is ready, upload the video to Warpwire, then embed the video in a new discussion for the group.
To upload your video to Warpwire:
- Click the Warpwire tab in the course Sakai site.
- Click the “+” and select “Upload files”.
- Locate the video on your computer and click to upload.
- Once you’ve uploaded the video to Warpwire, click to share the video and copy the video’s URL. You will need this when you post the video in the discussion forum.
To post the video to the discussion forum
- Click the Presentations tab in the course Sakai site.
- Click the Presentations topic.
- Click “Start a new conversation”.
- Make the title “Your Team Name: Project Title”. For example, “Teaching Team: Our Awesome Presentation”.
- Click the Warpwire icon (between the table and shopping cart icons).
- Select your video, then click “Insert 1 item.” This will embed your video in the conversation.
- Under the video, paste the URL to your video.
- You’re done!
You can see the Teaching Team example in Sakai.
Presentation comments
Each student will be assigned 2 presentations to watch. Click here to see your viewing assignments.
Watch the group’s video, then click “Reply” to post a question for the group. You may not post a question that’s already been asked on the discussion thread. Additionally, the question should be (i) substantive (i.e. it shouldn’t be “Why did you use a bar plot instead of a pie chart”?), (ii) demonstrate your understanding of the content from the course, and (iii) relevant to that group’s specific presentation, i.e demonstrating that you’ve watched the presentation.
You may start posting questions and comments on Thursday, December 09. All comments must be posted by Friday, December 10 at 11:59pm.
This portion of the project will be assessed individually.
Project repository
All written work (with exception of presentation slides) should be reproducible, and the GitHub repo should be neatly organized.
The GitHub repo should have the following structure:
README: Short project description and data dictionarywritten-report.Rmd&written-report.pdf/data: Folder that contains the data set for the final project.project-proposal.Rmd&project-proposal.pdf/presentation: Folder with the presentation slides.- If your presentation slides are online, you can put a link to the slides in a
README.mdfile in thepresentationfolder.
- If your presentation slides are online, you can put a link to the slides in a
Points for reproducibility + organization will be based on the reproducibility of the written report and the organization of the project GitHub repo. The repo should be neatly organized as described above, there should be no extraneous files, all text in the README should be easily readable.
Peer teamwork evaluation
You will be asked to fill out a survey where you rate the contribution and teamwork of each team member by assigning a contribution percentage for each team member. Filling out the survey is a prerequisite for getting credit on the team member evaluation. If you are suggesting that an individual did less than half the expected contribution given your team size (e.g., for a team of four students, if a student contributed less than 12.5% of the total effort), please provide some explanation. If any individual gets an average peer score indicating that this was the case, their grade will be assessed accordingly.
Update (12/9/2021)
If you have concerns with the teamwork and/or contribution from any team members, please email me by Friday, December 10 at 11:59pm with a brief description of your concerns. You only need to email me if you have concerns. Otherwise, I will assume everyone on the team equally contributed and will receive full credit for the teamwork portion of the grade.
Grading details
Grading of the project will take into account the following:
- Content - What is the quality of research and/or policy question and relevancy of data to those questions?
- Correctness - Are statistical procedures carried out and explained correctly?
- Writing and Presentation - What is the quality of the statistical presentation, writing, and explanations?
- Creativity and Critical Thought - Is the project carefully thought out? Are the limitations carefully considered? Does it appear that time and effort went into the planning and implementation of the project?
A general breakdown of scoring is as follows:
- 90%-100%: Outstanding effort. Student understands how to apply all statistical concepts, can put the results into a cogent argument, can identify weaknesses in the argument, and can clearly communicate the results to others.
- 80%-89%: Good effort. Student understands most of the concepts, puts together an adequate argument, identifies some weaknesses of their argument, and communicates most results clearly to others.
- 70%-79%: Passing effort. Student has misunderstanding of concepts in several areas, has some trouble putting results together in a cogent argument, and communication of results is sometimes unclear.
- 60%-69%: Struggling effort. Student is making some effort, but has misunderstanding of many concepts and is unable to put together a cogent argument. Communication of results is unclear.
- Below 60%: Student is not making a sufficient effort.
Late work policy
There is no late work accepted on this project. Be sure to turn in your work early to avoid any technological mishaps.
Additional notes and tips
The project is very open ended. For instance, in creating a compelling visualization(s) of your data in R, there is no limit on what tools or packages you may use. You do not need to visualize all of the data at once. A single high quality visualization will receive a much higher grade than a large number of poor quality visualizations.
Before you finalize your write up, make sure the printing of code chunks is turned off with the option echo = FALSE. In addition to code chunks, ensure all messages are turned off with the options warning = FALSE and echo = FALSE.
Finally, pay attention to details in your write-up and presentation. Neatness, coherency, and clarity will count.
Tips
-
Ask questions if any of the expectations are unclear.
-
Code: In your write up your code should be hidden (
echo = FALSE) so that your document is neat and easy to read. However your document should include all your code such that if I re-knit your Rmd file I should be able to obtain the results you presented.- Exception: If you want to highlight something specific about a piece of code, you’re welcome to show that portion.
-
Merge conflicts will happen, issues will arise, and that’s fine! Commit and push often, and ask questions when stuck.
-
Make sure each team member is contributing, both in terms of quality and quantity of contribution (we will be reviewing commits from different team members).
-
All team members are expected to contribute equally to the completion of this assignment and group assessments will be given at its completion - anyone judged to not have sufficient contributed to the final product will have their grade penalized. While different teams members may have different backgrounds and abilities, it is the responsibility of every team member to understand how and why all code and approaches in the assignment works.
Formatting + communication
Suppress Code, Warnings, & Messages
- Include the following code in a code chunk at the top of your .Rmd file to suppress all code, warnings, and other messages. Use the code chunk header
{r set-up, include = FALSE}to suppress this set up code.
knitr::opts_chunk$set(echo = FALSE,
                      warning = FALSE,
                      message = FALSE)
Headers
- Use headers to clearly label each section. Make sure there is a space between the last
#and the title, so the header renders correctly. For example,###Section Titlewill not render as header, but### Section Titlewill.
References
- Include all references in a section called “References” at the end of the report.
- This course does not have specific requirements for formatting citations and references.
- See Section 4.5 of the R Markdown Cookbook to learn about the citation functionality in R Markdown.
Appendix
- If you have additional work that does not fit or does not belong in the body of the report, you may put it at the end of the document in section called “Appendix”.
- The items in the appendix should be properly labeled.
- The appendix should only be for additional material. The reader should be able to fully understand your report without viewing content in the appendix.
Resize figures
- Resize plots and figures, so you have more space for the narrative.
- Resize individual figures: Use the code chunk header
{r plot1, fig.height = 3, fig.width = 5}, replacingplot1with a meaningful label and the height and width with values appropriate for your write up. - Resize all figures: Include the
fig_widthandfig_heightoptions in your YAML header as shown below:
- Resize individual figures: Use the code chunk header
---
title: "Your Title"
author: "Team Name + Group Members"
output:
  pdf_document:
    fig_width: 5
    fig_height: 3
---
Replace the height and width values with values appropriate for your write up.
Arranging plots
Arrange plots in a grid, instead of one after the other. This is especially useful when displaying plots for exploratory data analysis and to check assumptions.
-
If you’re using ggplot2 functions, the
patchworkpackage makes it easy to arrange plots in a grid. See the documentation and examples here. -
If you’re using base R function, i.e. when using the
emplogitfunctions, put the codepar(mfrow = c(rows,columns))before the code to make the plots. For example,par(mfrow = c(2,3))will arrange plots in a grid with 2 rows and 3 columns.
Plot titles and axis labels
Be sure all plot titles and axis labels are visible and easy to read.
- Use informative titles, not variable names, for titles and axis labels.
- Use
coord_flip()to flip the x and y axes on the plot. This is useful if you a bar plot with an x-axis that is difficult to read due to overlapping text.
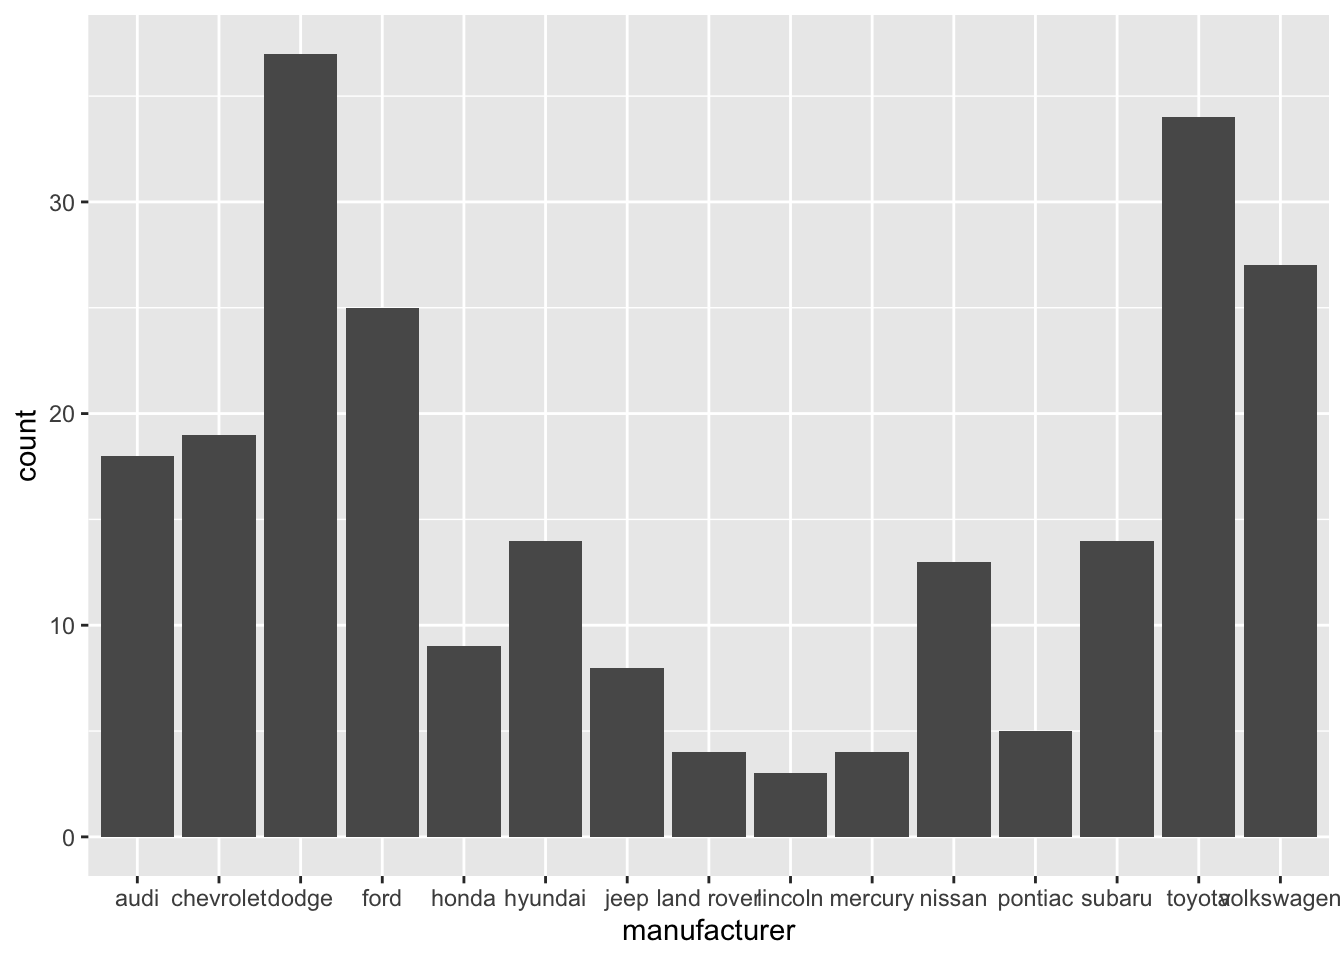
❌ NO! The x-axis is hard to read because the names overlap.
ggplot(data = mpg, aes(x = manufacturer)) +
  geom_bar()
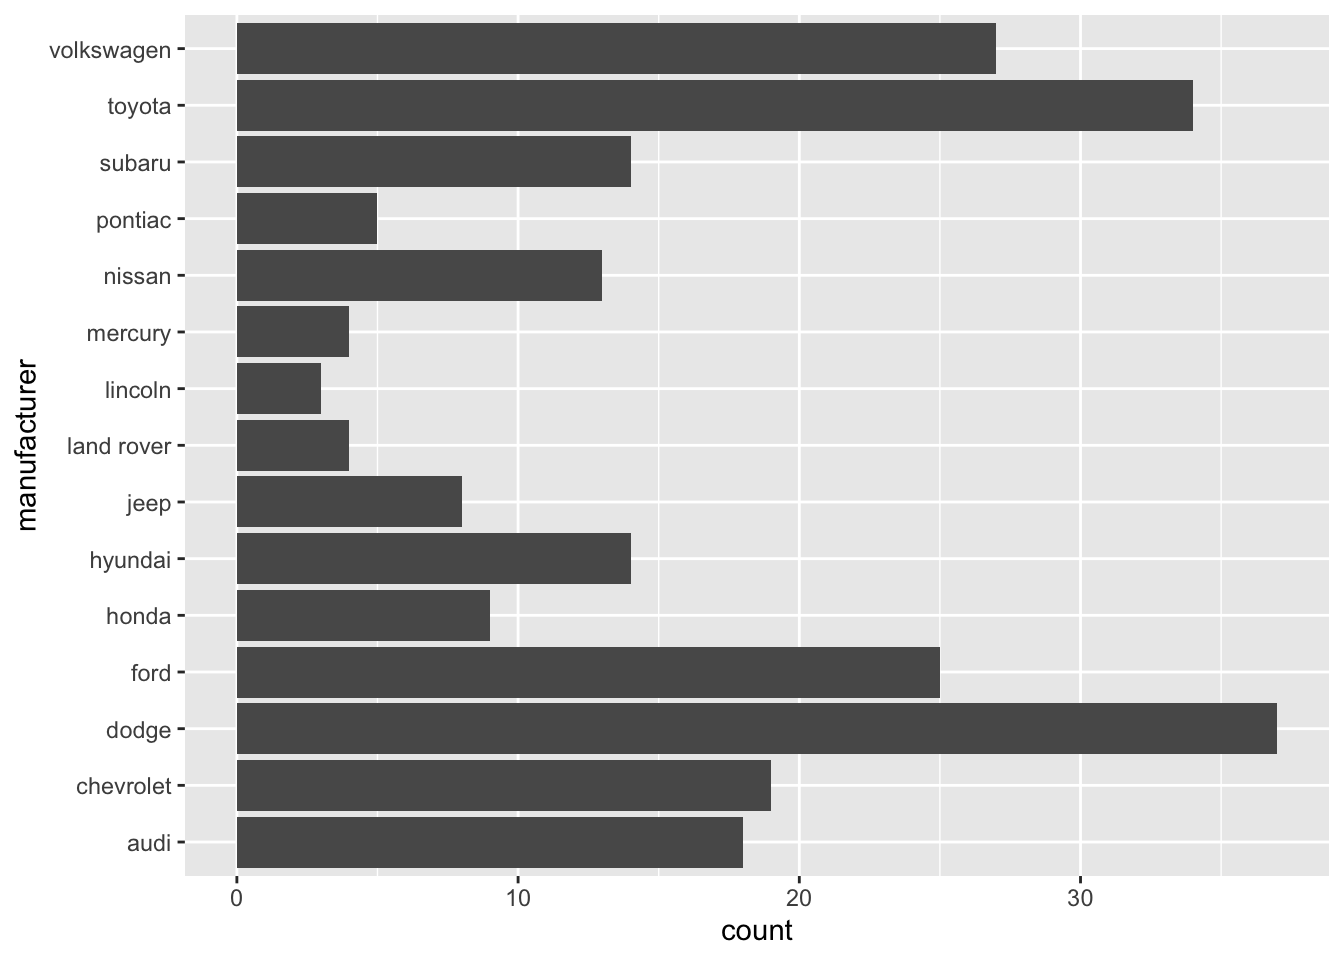
✅ YES! Names are readable
ggplot(data = mpg, aes(x = manufacturer)) +
  geom_bar() +
  coord_flip()
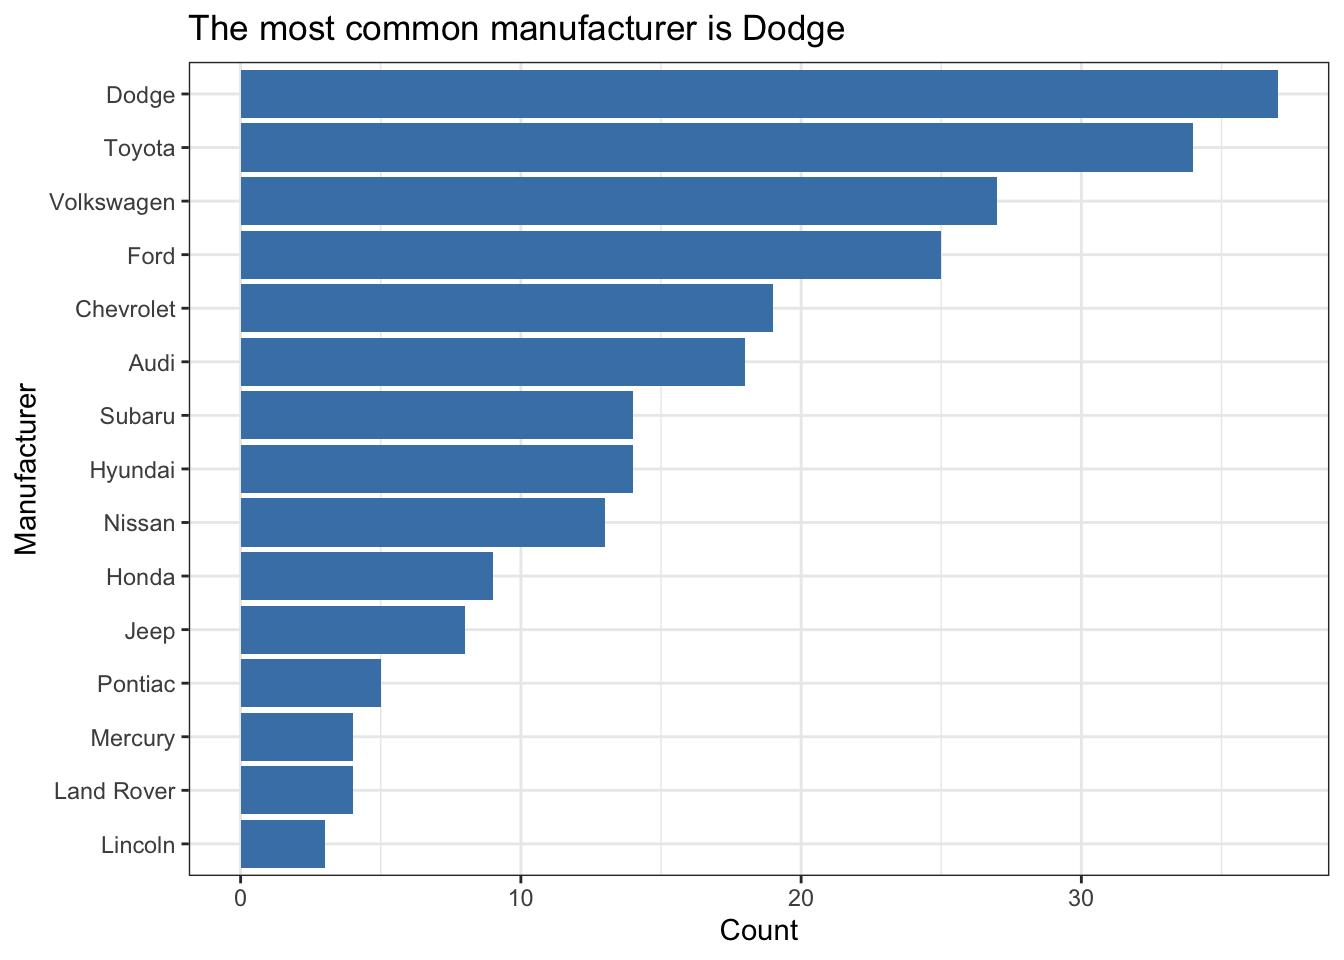
Do a little more to make the plot look professional!
- Informative title and axis labels
- Flipped coordinates to make names readable
- Arranged bars based on count
- Capitalized manufacturer names
- Optional: Added color - Use a coordinated color scheme throughout paper / presentation
- Optional: Applied a theme - Use same theme throughout paper / presentation
mpg %>%
  count(manufacturer) %>%
  mutate(manufacturer = str_to_title(manufacturer)) %>%
  ggplot(aes(x = fct_reorder(manufacturer,n), y = n)) +
  geom_bar(stat = "identity", fill = "steelblue") +
  coord_flip() +
  labs(x = "Manufacturer",
       y = "Count",
       title = "The most common manufacturer is Dodge") +
  theme_bw()
Tables and model output
- Use the
kablefunction from the knitr package to neatly output all tables and model output. This will also ensure all model coefficients are displayed.- Use the
digitsargument to display only 3 or 4 significant digits. - Use the
captionargument to add captions to your table.
- Use the
model <- lm(mpg ~ hp, data = mtcars)
tidy(model) %>%
  kable(digits = 3)
| term | estimate | std.error | statistic | p.value |
|---|---|---|---|---|
| (Intercept) | 30.099 | 1.634 | 18.421 | 0 |
| hp | -0.068 | 0.010 | -6.742 | 0 |
Guidelines for communicating results
- Don’t use variable names in your narrative! Use descriptive terms, so the reader understands your narrative without relying on the codebook.
- ❌ There is a negative linear relationship between mpg and hp.
- ✅ There is a negative linear relationship between a car’s fuel economy (in miles per gallon) and its horsepower.
- Know your audience: Your report should be written for a general audience who has an understanding of statistics at the level of STA 199.
- Avoid subject matter jargon: Don’t assume the audience knows all of the specific terminology related to your subject area. If you must use jargon, include a brief definition the first time you introduce a term.
- Tell the “so what”: Your report and presentation should be more than a list of interpretations and technical definitions. Focus on what the results mean, i.e. what you want the audience to know about your topic after reading your report or viewing your presentation.
- Tell a story: All visualizations, tables, model output, and narrative should tell a cohesive story!
- Use one voice: Though multiple people are writing the report, it should read as if it’s from a single author. At least one team member should read through the report before submission to ensure it reads like a cohesive document.